
Notice: iPad/iPhone WiFi Issues
If you are using IOS 14 or later on your iPad/iPhone and experiencing problems connecting to WiFi devices, please see these Instructions.
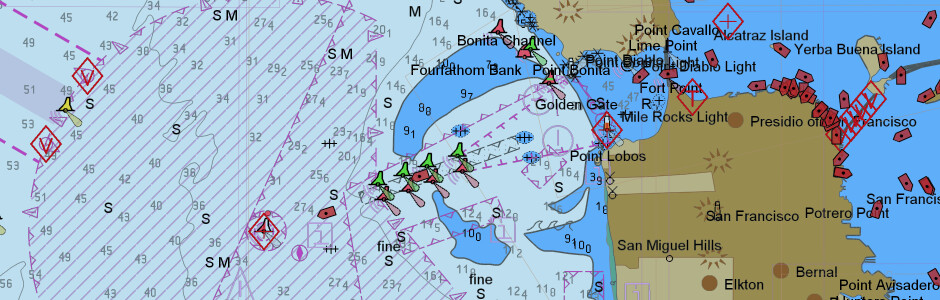
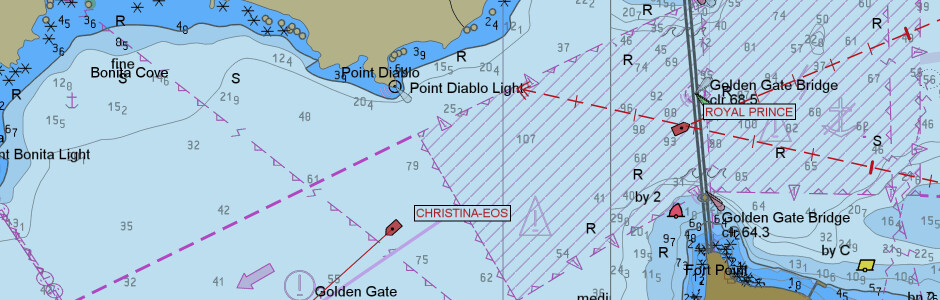
SEAiq Pilot is the only multi-platform piloting solution, with support for all major platforms and all pilot plugs and PPU devices. It combines a complete set of piloting features with unparalleled easy-of-use.
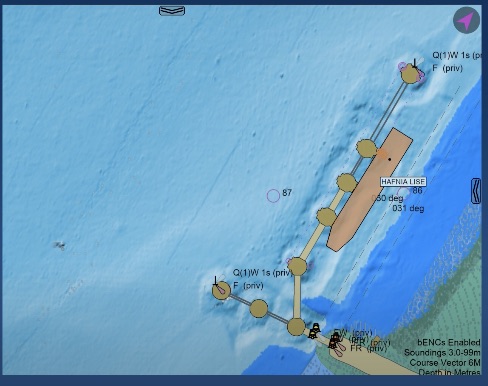
New: S-102, S-104, S-111
SEAiq Pilot incldues support for IHO S-100 series standards.
Features
SEAiq Pilot is packed with powerful features intended for use by professional Pilots.
Enterprise Subscription
We recommend organizations adopting SEAiq Pilot purchase our Enterprise Subscription. An Enterprise Subscription is the only way to purchase support for SEAiq Pilot.
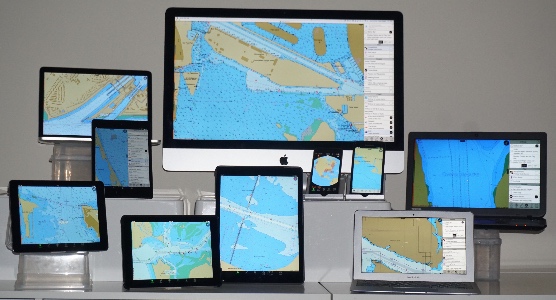
Supported Platforms
SEAiq Supports all major platforms, including Apple iPads/iPhones, Microsoft Windows, and Apple MacOS.